July 1, 2024
By Arne Ohlendorf, PhD, and Prof. Padmaja Sankaridurg, PhD, MIP
Photo Credit: Getty Images
Measurements of axial length are increasingly used to evaluate the progression of myopia. This development is being turbocharged by the availability of OCT-based biometers that provide more repeatable and accurate measurements than refractive error measurements. Software tools are also available to be used in conjunction with biometers and allow for a comprehensive evaluation of an individual’s myopia status, including the risk of progression. Furthermore, with orthokeratology, axial length measurement is the only way to ensure that progression is in check.
Although axial length values are increasingly used by eye care professionals, refractive error measurement is still important due to its relationship with functional visual acuity and change in prescription. Refractive error measure takes into account the relationship between the length of the eye and its major optical components, namely the cornea and lens. Similarly, axial length/corneal curvature is also a more comprehensive parameter as it considers the balance between axial length and corneal curvature.
But let’s consider the value of axial length measurements and the way we utilize this information for managing myopia.
A) Percentile Curves: Absolute and Relative (change over time) Axial Length Values
What exactly does an axial length value, such as, 24.00mm or 25.00mm, mean in the context of myopia? Although these values may appear ambiguous on their own, they become clinically relevant and meaningful when compared to reference values from the population, commonly referred to as growth charts or percentile curves.1,2,3 Such charts are increasingly being used in myopia management as they provide a reference for an individual value in the context of the population and help determine if a particular axial length is within normal range or “outside” the range. (Figure 1) The reference values or growth charts require that they be derived using large population-based datasets for various ethnic populations across a range of refractive errors, ages, and genders to ensure that they are representative of the population.
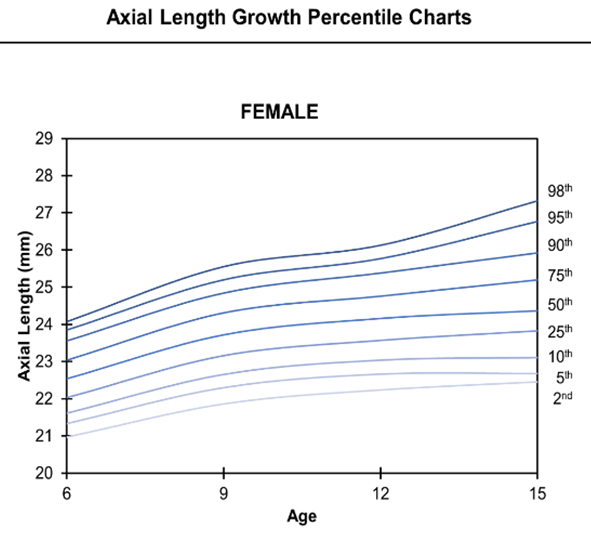
Figure 1: Axial length percentile curves for a female population in Wuhan, China. Figure adapted from Sanz Diez, P., Yang, LH., Lu, MX. et al.. Graefes Arch Clin Exp Ophthalmol 257, 1045–1053 (2019).https://rdcu.be/dK7ql
In the context of myopia, axial length values placed above the median percentile for a given age group may indicate an already myopic eye or a future risk of myopia and, therefore, require closer monitoring. Using age-specific normative axial length data, it is possible to monitor a child’s growth and identify eyes that are “out-of-normal.” This helps decide if myopia treatment is needed.
Thereafter, change over time can also be plotted on these charts to see if growth is tracking normally, is faster or slower than expected, or shows benefit by slowing with the use of myopia control strategies. Clinicians across the world are using growth or centile curves to decide if a child requires myopia management and to track the success of the treatment over time.
While they are user friendly, percentile curves do not provide information on whether the change is within a specific expected level of treatment objective. Furthermore, in populations with high myopia prevalence, the median percentile or even those lower than the median may not necessarily represent normal or physiological growth. Thus, making treatment choices based on the so-called “reference” may not be ideal and may require clinicians to use additional measures to assess whether treatment is successful.
B) Change in Axial Length Relative to Emmetropic and Myopic Eye Growth: The Emmetropic Progression Ratio
One of the goals of myopia treatment is to slow myopic eye growth to approach that of age-normal physiological growth observed in emmetropic children. Thus, as a target, it will be helpful to indicate how close myopic eyes with treatment approach physiological eye growth.
Emmetropic Progression Ratio (EPR) is such a measure that shows how much a myopia control intervention is slowing eye growth compared to physiological eye growth. EPR is calculated as below on a scale of 0 to 100%, where 0% means that axial length growth is equivalent to a myopic eye, and 100% means that axial length growth is equivalent to an emmetropic eye:
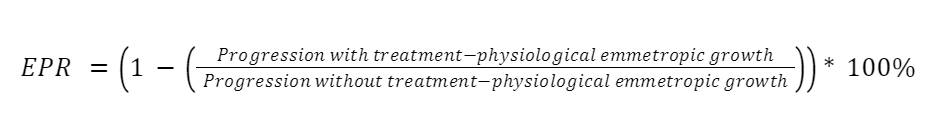
“Physiological emmetropic growth” and “progression without treatment” (i.e., myopic eye growth) are determined using reported evidence on annual emmetropic eye growth4-8 and myopic eye growth4-6,9-10 (corrected with single vision lenses). Overall, eye growth is dependent on age, with younger children showing more significant growth. Ethnicity can also affect eye growth. Myopic eyes of Asian ethnicities have higher axial length progression compared to Caucasians. Figure 2 displays annual emmetropic and myopic growth from children of East Asian ethnicity (red and gray lines), and the age-specific information is given in Table 1.
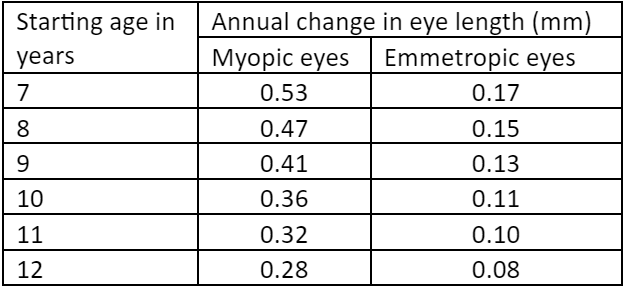
Table 1: Age-dependent changes in axial length in myopic and emmetropic eyes
Using this data, the effectiveness of myopia management therapy can be worked out for an individual eye. For example, if for a child aged 8 years, annual growth for a myopic eye is 0.47mm, for an emmetropic eye is 0.17mm, and growth with a myopia control treatment is 0.20mm, then utilizing the values we have (1- (0.20-0.17/0.47-0.20)) x 100 or 89%, indicating that the eye is closer to physiological growth.
Similarly, EPR can also be used to evaluate the overall effectiveness of a myopia management solution. Figure 2 presents the annualized axial elongation for a group of children aged 7-12 years wearing spectacle lenses comprising cylindrical annular refractive elements (C.A.R.E.) in a two-year, double-masked randomized clinical trial in China (China; ChiCTR2100054139). Two variants of the C.A.R.E. spectacle lenses (ZEISS MyoCare and ZEISS MyoCare S) were assessed in the trial. Annual changes in axial length with spectacles were used. EPRs were calculated to be 70% and 72% for MyoCare and MyoCare S, respectively, for the duration of the trial (shown as blue and dark blue lines in Figure 2).
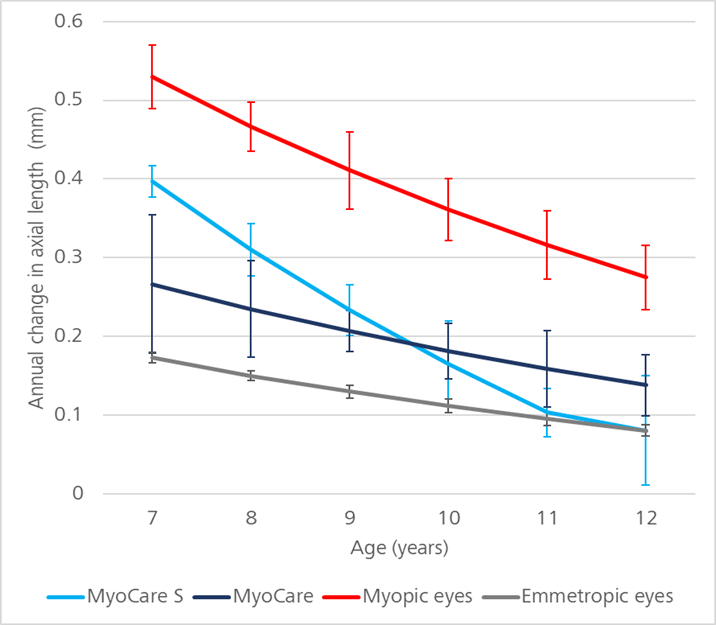
Figure 2: Age-dependent annual change in axial length of children wearing ZEISS MyoCare or ZEISS MyoCare S in a two-year trial. *Values over 100% were maintained as 100%, and error bars are SE.
In summary, the significance of axial length measurements in managing juvenile-onset myopia is increasing. Growth charts or percentile charts for axial length can assess the risk of myopia and track progression over time. However, when it comes to setting targets for the efficacy of myopia control, one approach is to compare axial length change with treatment to that of physiological eye growth and myopic eye growth. EPR is one such measure and helps practitioners evaluate clinical efficacy.
 |
Padmaja Sankaridurg, BOpt, MIP, PhD, is Head, Global Myopia Management at ZEISS VisionCare, a Conjoint Professor at the School of Optometry and Vision Science, Sydney, Australia, and a Council member of the International Society of Contact Lens Research. |
 |
Dr. Arne Ohlendorf is an optometrist by training with a Diploma in Vision Science from the University of Applied Sciences, Jena, and PhD in Neurobiology of the Eye from University of Tübingen. Dr. Ohlendorf has been with ZEISS Vision Care since 2011 and is a Staff Scientist and member of the Myopia Team. |
References
- Sanz Diez P, Yang LH, Lu MX, Wahl S, Ohlendorf A. Growth curves of myopia-related parameters to clinically monitor the refractive development in Chinese schoolchildren. Graefes Arch Clin Exp Ophthalmol. 2019 May;257(5):1045-1053.
- Truckenbrod C, Meigen C, Brandt M, Vogel M, Sanz Diez P, Wahl S, Jurkutat A, Kiess W. Longitudinal analysis of axial length growth in a German cohort of healthy children and adolescents. Ophthalmic Physiol Opt. 2021 May;41(3):532-540.
- He X, Sankaridurg P, Naduvilath T, Wang J, Xiong S, Weng R, Du L, Chen J, Zou H, Xu X. Normative data and percentile curves for axial length and axial length/corneal curvature in Chinese children and adolescents aged 4-18 years. Br J Ophthalmol. 2023 Feb;107(2):167-175.
- Chamberlain, P., Lazon de la Jara, P., Arumugam, B., & Bullimore, M. A. (2021). Axial length targets for myopia control. Ophthalmic and Physiological Optics, 41(3), 523-531.
- Ma, Y., Zou, H., Lin, S., Xu, X., Zhao, R., Lu, L., … & He, X. (2018). Cohort study with 4-year follow‐up of myopia and refractive parameters in primary schoolchildren in Baoshan district, Shanghai. Clinical & Experimental Ophthalmology, 46(8), 861-872.
- Naduvilath, T., He, X., Xu, X., & Sankaridurg, P. (2023). Normative data for axial elongation in Asian children. Ophthalmic and Physiological Optics, 43(5), 1160-1168.
- Truckenbrod, C., Meigen, C., Brandt, M., Vogel, M., Wahl, S., Jurkutat, A., & Kiess, W. (2020). Reference curves for refraction in a German cohort of healthy children and adolescents. PLoS One, 15(3), e0230291.
- Kaymak, H., Graff, B., Neller, K., Langenbucher, A., Seitz, B., & Schwahn, H. (2021). Myopietherapie und Prophylaxe mit „Defocus Incorporated Multiple Segments “-Brillengläsern. Der Ophthalmologe, 118(12), 1280-1286.
- Cross-sectional and longitudinal observational data on axial length progression in two cohorts of Asian children. Data on file. Technology and Innovation, Carl Zeiss Vision International GmbH, DE, 2023
- Li, T., Jiang, B., & Zhou, X. (2019). Axial length elongation in primary school-age children: a 3-year cohort study in Shanghai. BMJ open, 9(10), e029896